In Part 1, we installed PlotJuggler and connected a ROS2 subscriber to stream live data from the G1. But live data only helps while the robot is running. When you want to replay and analyze a session that already happened — say the robot fell at 14:03 and you need to know why — you need a bag file.
The best bag format for ROS2 today is .mcap: self-contained schemas, fast random-access seeking, and PlotJuggler reads it directly via the DataLoadMCAP plugin.
This tutorial covers the full pipeline:
- Recording G1 data into
.mcapfiles - Opening the file with the DataLoadMCAP plugin in PlotJuggler
- Dragging all 23 joint channels (q, dq, tau) into a synchronized multi-panel grid
- Saving the layout as
.xmlfor unlimited reuse across sessions - Creating phase portraits (joint angle vs velocity) using XY Scatter mode
Why Visualize All 23 Joints Simultaneously?
The G1 has 23 degrees of freedom. Each joint emits 3 data channels at the 500 Hz control loop rate:
| Channel | Symbol | Unit | Meaning |
|---|---|---|---|
| Position | q |
radian | Current joint angle |
| Velocity | dq |
rad/s | Rate of angle change |
| Torque | tau |
N·m | Force the motor is applying |
That's 23 × 3 = 69 channels per timestep. Clicking each one individually would take 69 drag-and-drop operations. Layout XML solves this: after a one-time setup, every future session takes two clicks — File → Load Layout.
More importantly: you can only see system-level patterns when all joints are visible simultaneously. For example, the left wrist starts oscillating 200ms before the robot loses balance — something you'd miss entirely if you were only watching the legs.
G1 Joint Layout (23 DOF)
Before getting started, internalize this joint index mapping. This is the 23-DOF variant (the most common G1 configuration — simplified waist and wrist):
Right Leg — indices 0–5:
  [0] hip_pitch      [1] hip_roll       [2] hip_yaw
  [3] knee_pitch     [4] ankle_pitch    [5] ankle_roll

Left Leg — indices 6–11:
  [6] hip_pitch      [7] hip_roll       [8] hip_yaw
  [9] knee_pitch    [10] ankle_pitch   [11] ankle_roll

Waist — indices 12–14:
  [12] waist_yaw    [13] waist_roll    [14] waist_pitch

Right Arm — indices 15–18:
  [15] shoulder_pitch  [16] shoulder_roll
  [17] elbow_pitch     [18] wrist_roll

Left Arm — indices 19–22:
  [19] shoulder_pitch  [20] shoulder_roll
  [21] elbow_pitch     [22] wrist_roll
After loading an MCAP file in PlotJuggler, these 69 channels appear as:
/lowstate/motor_state[0]/q    ... /lowstate/motor_state[22]/q
/lowstate/motor_state[0]/dq   ... /lowstate/motor_state[22]/dq
/lowstate/motor_state[0]/tau  ... /lowstate/motor_state[22]/tau
Part 1 — Verifying the DataLoadMCAP Plugin
The DataLoadMCAP plugin ships bundled with PlotJuggler 3.6.0 and later. To verify:
# Check version
ros2 run plotjuggler plotjuggler --version
# Must be >= 3.6.0

# Start PlotJuggler
source /opt/ros/humble/setup.bash
ros2 run plotjuggler plotjuggler &

# Navigate to App → Preferences → Loaded Plugins
# Look for "DataLoadMCAP" in the list
If building from source, the plugin lives at plotjuggler_plugins/DataLoadMCAP/. Build with MCAP support:
cd ~/ws_plotjuggler
colcon build --cmake-args -DCOMPILE_WITH_ROSBAG2=ON
If installed via APT or Snap, the plugin is already present — no extra steps needed.
Part 2 — Recording G1 Data as .mcap
Step 2.1 — Install the storage plugin
MCAP is not ROS2's default bag format (that's SQLite .db3). You need an extra package:
sudo apt install ros-$ROS_DISTRO-rosbag2-storage-mcap
# e.g., ros-humble-rosbag2-storage-mcap
Verify it's available:
ros2 bag record --help | grep storage
# Should list "mcap" as one of the available storage backends
Step 2.2 — Record from the G1
On the machine connected to G1 (DDS domain must match — see Part 1 for CycloneDDS configuration):
# Create a directory for bag files
mkdir -p ~/g1_bags

# Start recording — timestamp in the name for easy identification
ros2 bag record \
  --storage mcap \
  --output ~/g1_bags/g1_walk_$(date +%Y%m%d_%H%M%S) \
  /lowstate \
  /imu_state \
  /tf \
  /tf_static

# Press Ctrl+C when finished
Storage note: At 500 Hz,
/lowstategenerates roughly 2–3 MB/second. A 5-minute session ≈ 900 MB. Add--max-bag-size 1073741824(1 GB) to automatically split files.
Naming convention:
g1_fall_20260615_143000beatstest_bag_3when you revisit these files three months later.
Step 2.3 — Verify the bag
ros2 bag info ~/g1_bags/g1_walk_20260615_143000/

# Expected output:
# Files:         g1_walk_20260615_143000_0.mcap
# Duration:      30.512s
# Start:         Jun 15 2026 14:30:00.142
# End:           Jun 15 2026 14:30:30.654
# Messages:      91536
# Topic information:
#   Topic: /lowstate   | Type: unitree_hg/msg/LowState | Count: 15256 | Freq: 500.0
#   Topic: /imu_state  | Type: sensor_msgs/msg/Imu     | Count: 15256 | Freq: 500.0
If /lowstate Count ≈ Duration × 500, the bag has no dropped frames.
Part 3 — Loading the .mcap File in PlotJuggler

Step 3.1 — Open the file
-
On the main toolbar, click "Data" → "Load Data File" (or
Ctrl+O) -
In the file dialog, navigate to your bag folder and select the
.mcapfile:~/g1_bags/g1_walk_20260615_143000/g1_walk_20260615_143000_0.mcap -
PlotJuggler auto-detects the plugin from the file extension. If a dialog appears asking which plugin to use, select "DataLoadMCAP".
Step 3.2 — DataLoadMCAP configuration dialog
The plugin presents a brief configuration dialog before parsing:
-
Time reference (radio button):
logTime: Timestamp when the message was written into the MCAP file. Use this for offline analysis.publishTime: Timestamp when the message was published on the ROS2 topic. May drift if there's network latency.- Recommended for G1: select
logTime.
-
Topic filter: Search box to load only certain topics. Type
lowstateto load just joint data without IMU or TF (faster). -
Max array size: Leave at default — G1 has only 23
motor_stateelements.
Click OK. PlotJuggler parses the file and shows a real progress bar. A 30-second bag typically loads in 2–5 seconds.
Step 3.3 — After loading
The "Timeseries List" panel on the left expands to 200+ channels in a tree:
▶ /lowstate
  ▶ motor_state
    ▶ [0]
      ├── q          ← position of joint 0 (right hip_pitch)
      ├── dq         ← velocity of joint 0
      ├── tau        ← torque of joint 0
      ├── temperature
      └── lost
    ▶ [1]
      ...
    ▶ [22]           ← joint 22 (left wrist_roll)
Filtering tip: Use the search box above the Timeseries List. Type
/qto filter down to just the 23 position channels. Typemotor_state\[0to see all fields of joint 0.
Part 4 — Building the Multi-Panel Layout
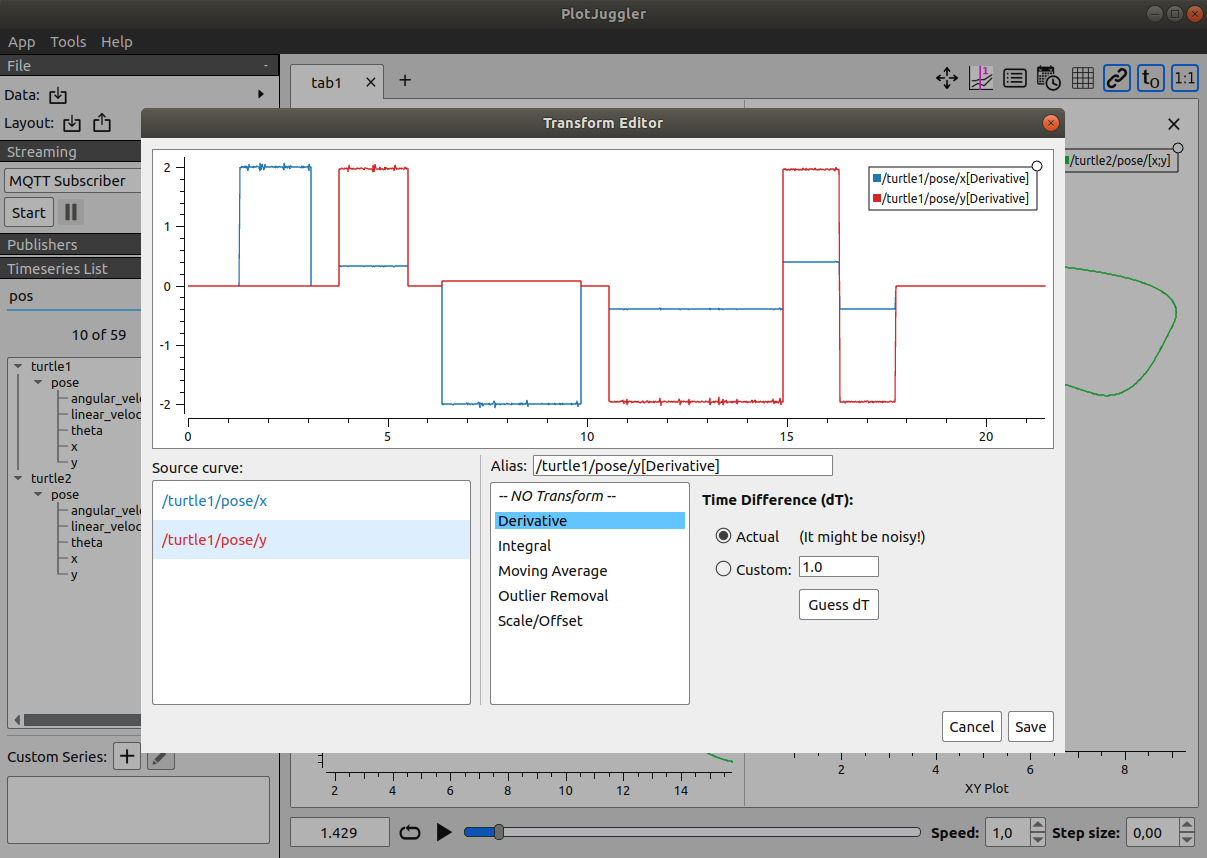
Multi-panel layout: multiple plots share the same timeline and time cursor — source: facontidavide/PlotJuggler repo
The target: a 3-panel layout showing all 23 joints' position, velocity, and torque simultaneously.
Step 4.1 — Create 3 panels
- Right-click in the main plot area → "Split Horizontally" → Creates 2 rows.
- Right-click the bottom panel → "Split Horizontally" again → Now 3 rows.
- Rename each panel by clicking its title bar:
- Top panel:
Position (q) [rad] - Middle panel:
Velocity (dq) [rad/s] - Bottom panel:
Torque (tau) [N·m]
- Top panel:
Step 4.2 — Drag by group
Populate Position panel:
- In the Timeseries List filter, type:
/lowstate/motor_state.*\]/q - Press
Ctrl+Ato select all 23 filteredqchannels - Drag into the top panel (Position)
Populate Velocity panel:
- Clear the filter, type:
/lowstate/motor_state.*\]/dq Ctrl+A→ drag into the middle panel (Velocity)
Populate Torque panel:
- Filter:
/lowstate/motor_state.*\]/tau Ctrl+A→ drag into the bottom panel (Torque)
Each panel now shows 23 curves with auto-assigned colors by joint index. Hover over any curve to see its channel name in the tooltip.
Alternative layout: By body segment
For debugging a specific limb, body-segment layouts are clearer:
Tab "Legs" (3 panels):
  ├── q[0-5] vs q[6-11]    (right vs left — compare gait symmetry)
  ├── dq[0-5] vs dq[6-11]
  └── tau[0-5] vs tau[6-11]

Tab "Torso + Arms" (2 panels):
  ├── q[12-14], q[15-22]
  └── tau[12-14], tau[15-22]
Add a new tab by clicking the "+" button next to the tab name bar at the bottom of the layout area.
Part 5 — Time Cursor Synchronization
This is what makes multi-panel genuinely useful: all panels update in sync as you move the time cursor.
Timeline navigation:
- Drag the timeline bar at the bottom: all panels scroll in sync
- Scroll the mouse on any panel: zoom the time axis
- Ctrl + scroll: zoom only that panel's Y axis
Linking zoom across panels:
Click the "Link" button (chain icon) on the toolbar → When you zoom into a time range on the Position panel, the Velocity and Torque panels zoom to the same range automatically. Essential for examining a specific event.
Adding vertical markers:
Right-click on any panel → "Add Vertical Line" → Enter timestamp
For example, set a marker at t = 14.340 — the moment the robot fell. The marker appears across all panels. Scroll back to t = 13.8 to examine the 500ms leading up to the fall.
Real debugging example with G1:
Marker placed at
t = 14.340. Looking at the Torque panel: joint[4](right ankle_pitch) saturates at ±18 N·m starting fromt = 13.85— 490ms before the fall. In the Position panel at the same moment:q[4]is at -0.35 rad, near its joint limit. The controller is fighting gravity with maximum torque but losing. Root cause: terrain slope that the motion planner didn't account for.
Part 6 — Saving and Loading Layout XML
Saving
After configuring your layout, save immediately before closing PlotJuggler:
File → Save Layout (or Ctrl+S)
Use a descriptive name:
g1_23joints_q_dq_tau_v1.xml
Organize layouts in a dedicated directory:
mkdir -p ~/plotjuggler_layouts/g1/

# Core layout
~/plotjuggler_layouts/g1/g1_23joints_q_dq_tau_v1.xml

# Specialized layouts
~/plotjuggler_layouts/g1/g1_legs_comparison.xml
~/plotjuggler_layouts/g1/g1_arms_only.xml
What the XML captures:
<!-- Simplified example of PlotJuggler's layout XML structure -->
<PlotJuggler version="3.8">
  <CurrentPlots>
    <Tab name="Main">
      <Row>
        <Plot name="Position (q) [rad]">
          <Curve name="/lowstate/motor_state[0]/q" color="#E8544A"/>
          <Curve name="/lowstate/motor_state[1]/q" color="#5B9BD5"/>
          <!-- ... 21 more curves ... -->
        </Plot>
      </Row>
    </Tab>
  </CurrentPlots>
</PlotJuggler>
The XML stores everything: panel count and positions, which channels go into which panels, per-curve colors, active tab, and zoom link state.
Loading a saved layout
Your next debug session becomes:
1. ros2 run plotjuggler plotjuggler
2. File → Load Data File → select new .mcap
3. File → Load Layout → g1_23joints_q_dq_tau_v1.xml
4. Analyze
PlotJuggler automatically maps channel names from the XML to the freshly loaded data. The only requirement: channel names in the new bag must match those stored in the XML — guaranteed if you use the same G1 driver and topic names.
Sharing layouts across a team
Layout XML is plain text — commit it to Git:
cd ~/workspace/g1_project/
mkdir -p plotjuggler_layouts/

cp ~/plotjuggler_layouts/g1/*.xml plotjuggler_layouts/

git add plotjuggler_layouts/
git commit -m "feat: PlotJuggler layouts for 23-joint G1 debugging"
git push
The whole team shares the same layout. When you discover a better view arrangement, commit the new version and everyone benefits immediately.
Part 7 — XY Scatter: Drawing Phase Portraits
A phase portrait plots joint position (q) on the X axis and joint velocity (dq) on the Y axis. The curve shape reveals dynamic joint behavior that a time series alone cannot clearly show.
Reading phase portraits
| Shape | Meaning |
|---|---|
| Regular, repeating ellipse | Harmonic oscillation — healthy gait |
| Distorted or clipped ellipse | Joint hitting its limit or torque being clamped |
| Vertical line | Joint locked (zero velocity) |
| Inward spiral | Damped oscillation — normal when decelerating |
| Chaotic trajectory | Instability or uncontrolled oscillation |
Creating an XY Scatter
-
In the Timeseries List, click
/lowstate/motor_state[3]/q(e.g., right knee) -
Hold Ctrl + click
/lowstate/motor_state[3]/dq -
Hold right-click and drag both channels into an empty panel
-
PlotJuggler shows a dialog → Select "XY Scatter"
-
Press Play (▶) to watch the phase portrait trajectory animate over time
Example: Debugging knee joint symmetry in walking gait
Create side-by-side phase portraits for joint [3] (right knee_pitch) and joint [9] (left knee_pitch):
- Right knee portrait: Regular ellipse, good width — healthy flexion
- Left knee portrait: Flattened ellipse, narrower angle range — less knee flex on the left
Interpretation: Asymmetric gait due to either different PD gains or higher joint friction on the left. Next step: compare tau[3] vs tau[9]. If the right torque is higher for the same position → friction difference. If torques are equal → controller parameter mismatch.
Putting It All Together: Complete Debug Workflow
After this article, your pipeline looks like this:
# 1. Record bag (on the machine connected to G1)
ros2 bag record --storage mcap \
  -o ~/g1_bags/g1_$(date +%Y%m%d_%H%M%S) \
  /lowstate /imu_state

# 2. Open PlotJuggler
ros2 run plotjuggler plotjuggler

# 3. Load bag + layout
# File → Load Data File → select .mcap
# File → Load Layout → g1_23joints_q_dq_tau_v1.xml

# 4. Locate the anomaly
# Scrub timeline, place marker at the event

# 5. Analyze suspect joint with phase portrait
# Ctrl+click q + dq → right-click drag → XY Scatter → Play
You just turned 69 channels of raw data into a reusable debug dashboard with a single XML file. In Part 3, we'll dig into IMU data: converting quaternions to Euler angles with a Lua script and using FFT to locate abnormal vibration frequencies in G1's gait.