In the previous two parts, we built the complete pipeline: PlotJuggler live streaming from G1 (part 1), and organizing the 23-joint layout with MCAP recording (part 2). Now comes the more interesting part — actually analyzing the IMU data.
The Unitree G1's pelvis-mounted IMU publishes at 500 Hz. From this single sensor, we can answer three critical questions: How much is the robot tilted along each axis? Are there unusual vibration frequencies in the joints? Which foot is bearing weight and which is in swing?
Three questions, three tools: ToolboxQuaternion, ToolboxFFT, and the Moving Average transform. This tutorial covers all three.
Series Roadmap
| # | Article | Content |
|---|---|---|
| 1 | Setup & Live Streaming | Install PlotJuggler, CycloneDDS, subscribe /lowstate |
| 2 | 23-Joint Layout + MCAP | Multi-panel layout, .mcap files, phase portraits |
| 3 | IMU Debug + FFT (this article) | Quaternion → Euler, FFT vibration analysis, Moving Average foot_force |
| 4 | Lua Transforms | Custom Lua scripts for derived metrics |
| 5 | ZMQ + Video Sim2Real | ZMQ bridge from MuJoCo, camera overlay, sim2real comparison |
G1 IMU Data Structure — Quick Reference
The IMU channels under /lowstate are:
/lowstate/imu_state/
  ├── quaternion[0]    ← w (scalar part)
  ├── quaternion[1]    ← x (imaginary — pitch axis)
  ├── quaternion[2]    ← y (imaginary — roll axis)
  ├── quaternion[3]    ← z (imaginary — yaw axis)
  ├── rpy[0]           ← roll  (rad) — computed by firmware
  ├── rpy[1]           ← pitch (rad) — computed by firmware
  ├── rpy[2]           ← yaw   (rad) — computed by firmware
  ├── accelerometer[0] ← ax (m/s²) — body frame X
  ├── accelerometer[1] ← ay (m/s²) — body frame Y
  ├── accelerometer[2] ← az (m/s²) — body frame Z (≈9.81 when upright)
  ├── gyroscope[0]     ← ωx (rad/s) — angular velocity around X
  ├── gyroscope[1]     ← ωy (rad/s) — angular velocity around Y
  └── gyroscope[2]     ← ωz (rad/s) — angular velocity around Z
Obvious question: G1 already provides
/lowstate/imu_state/rpy[0..2]— why do we need ToolboxQuaternion?
The answer: the rpy values from firmware pass through G1's onboard filter and may exhibit drift or apply a different Euler convention than what your analysis requires. The quaternion is the raw sensor output — more accurate, and it lets you choose your own Euler convention during conversion. When debugging issues like "robot thinks it's upright but it's actually tilted," comparing firmware rpy against quaternion-derived Euler angles is the first diagnostic step.
Part 1: ToolboxQuaternion — Converting Quaternion to Euler Angles
Why Quaternions Are Tricky
Imagine describing your phone's orientation: "Tilt 30 degrees along the vertical axis, then rotate 15 degrees sideways." That's Euler angles — three sequential rotations. Intuitive and easy to read.
But computers have a problem with Euler angles: rotate past 90 degrees on one axis and you hit Gimbal Lock — the robot reports 180-degree pitch while roll suddenly jumps ±90 degrees. Quaternions avoid this entirely by representing orientation as a point on a 4-dimensional unit sphere: no singularities, no unexpected wrap-arounds.
For debugging, you need both: quaternions for numerically correct computation, Euler angles for the charts where you need to immediately understand what the robot is doing.
Opening ToolboxQuaternion
The ToolboxQuaternion plugin is bundled in plotjuggler_plugins/ToolboxQuaternion/ and available from PlotJuggler 3.7+. No additional installation needed if you're using ros-humble-plotjuggler-ros.
Access from the menu:
PlotJuggler Menu → Tools → Toolboxes → Quaternion To RPY
Or look for the toolbox icon (🧰) on the main toolbar. If it's missing, verify your installation:
ros2 run plotjuggler plotjuggler --version
# Then: App → Preferences → Loaded Plugins
# Look for "ToolboxQuaternion" in the list
Mapping G1 Quaternion Channels to the Toolbox
When the Quaternion To RPY Toolbox dialog opens, you'll see four dropdowns for assigning inputs:
┌─────────────────────────────────────────────────────┐
│  Quaternion To RPY                                  │
│                                                     │
│  W (scalar):  [/lowstate/imu_state/quaternion[0] ▼] │
│  X:           [/lowstate/imu_state/quaternion[1] ▼] │
│  Y:           [/lowstate/imu_state/quaternion[2] ▼] │
│  Z:           [/lowstate/imu_state/quaternion[3] ▼] │
│                                                     │
│  Suffix: [_imu_pj]                                  │
│                                                     │
│  [Compute]                    [Close]               │
└─────────────────────────────────────────────────────┘
Channel assignment:
- W (scalar):
/lowstate/imu_state/quaternion[0]— the real/scalar part in G1's quaternion - X:
/lowstate/imu_state/quaternion[1] - Y:
/lowstate/imu_state/quaternion[2] - Z:
/lowstate/imu_state/quaternion[3] - Suffix: Enter something like
_imu_pjto avoid collision with the existingrpychannels
Click Compute. PlotJuggler calculates and adds three new channels to the Signal List:
/lowstate/imu_state/quaternion_imu_pj/roll    ← radians, range [-π, +π]
/lowstate/imu_state/quaternion_imu_pj/pitch   ← range [-π/2, +π/2]
/lowstate/imu_state/quaternion_imu_pj/yaw     ← range [-π, +π]
The Conversion Formula
The toolbox uses ZYX (Tait-Bryan) convention — the most common in robotics and aerospace:
roll  = atan2( 2(w·x + y·z),   1 - 2(x² + y²) )
pitch = arcsin( 2(w·y - z·x) )
yaw   = atan2( 2(w·z + x·y),   1 - 2(y² + z²) )
With G1 standing still and upright, expect:
roll ≈ 0(not tilting sideways)pitch ≈ 0(not leaning forward or back)yawvaries based on which direction the robot is facing (irrelevant when stationary)
Comparing Quaternion Euler vs Firmware RPY
After computing, drag six channels into two side-by-side panels:
Top panel (Quaternion → Euler):
  /lowstate/imu_state/quaternion_imu_pj/roll
  /lowstate/imu_state/quaternion_imu_pj/pitch

Bottom panel (Firmware RPY):
  /lowstate/imu_state/rpy[0]   ← firmware roll
  /lowstate/imu_state/rpy[1]   ← firmware pitch
Under normal conditions, both pairs should nearly overlap. If they diverge:
| Symptom | Likely cause |
|---|---|
| Fixed offset (e.g., Euler = firmware + 0.05 rad) | G1 firmware applies a calibration offset |
| Divergence only during fast motion | Filter latency in firmware vs raw quaternion |
| Sudden jump during rapid rotation | Gimbal lock in firmware Euler — quaternion is unaffected |
| Growing drift when stationary | Uncompensated IMU drift — check magnetometer or EKF integration |
Enabling Toolbox for Live Streaming
By default, ToolboxQuaternion only processes data already loaded from a file. To enable real-time streaming (when using the ROS2 Topic Subscriber):
In the Toolbox window → Check "Apply to streaming data" → Compute
Once enabled, the three roll/pitch/yaw channels update in real time alongside the raw quaternion data.
Part 2: ToolboxFFT — Frequency Analysis for Vibration Detection
Understanding FFT in 30 Seconds
Think of a piece of music — sound is a complex wave oscillating over time. FFT (Fast Fourier Transform) decomposes that music into individual notes by frequency: how much bass (20-200 Hz), how much treble (2000-20000 Hz).
For G1, instead of sound, we have gyroscope signals (rad/s) over time. FFT decomposes this into:
- Gait frequency (~1-2 Hz): the robot is walking, the torso sways gently
- Balance controller activity (~10-30 Hz): controller "twitching" to maintain upright posture
- Mechanical resonance of joints (~20-80 Hz): if there's an unexpected peak here → mechanical problem
Opening ToolboxFFT
PlotJuggler Menu → Tools → Toolboxes → FFT
The FFT Toolbox dialog:
┌─────────────────────────────────────────────────────┐
│  FFT Toolbox                                        │
│                                                     │
│  Input signal: [/lowstate/imu_state/gyroscope[1] ▼] │
│                                                     │
│  Time range:   [Use full range]  [Last N seconds: 10]│
│  Window:       [Hann ▼]                             │
│                                                     │
│  Output suffix: [_fft_gyroY]                        │
│                                                     │
│  [Compute FFT]                [Close]               │
└─────────────────────────────────────────────────────┘
Key parameters:
| Parameter | Recommendation | Reason |
|---|---|---|
| Window | Hann | Minimizes spectral leakage — best for robot signals that aren't perfectly periodic |
| Time range | Last 10-30 seconds | Enough duration for good frequency resolution (Δf = 1/T) |
| Frequency resolution | Δf = 1/T | At T = 10s: Δf = 0.1 Hz — sufficient to separate 1 Hz from 1.1 Hz |
FFT Application Strategy for G1
Apply FFT in this order for systematic debugging:
Step 1: FFT on pitch-axis gyroscope (ωy) — most critical
Input: /lowstate/imu_state/gyroscope[1] ← ωy (sagittal plane angular velocity)
This axis has the most influence on forward-backward balance. In normal walking gait:
Normal FFT spectrum (G1 simple walking):

Amplitude
  │
  │      █                     ← peak ~1.5 Hz: gait frequency
  │
  │        █                   ← peak ~3 Hz: 2nd harmonic
  │
  │            █ █             ← peaks 5-15 Hz: hip-waist interaction
  │
  │                            ← flat: no energy at 20-80 Hz (good!)
  └──────────────────────────── Hz
      1  2  3  5   10   20   50
Step 2: FFT on roll-axis gyroscope (ωx)
Input: /lowstate/imu_state/gyroscope[0]
Lateral oscillation — should be smaller during straight walking. A large peak here → robot is over-correcting lateral sway → inspect hip roll controller.
Step 3: FFT on vertical accelerometer (az)
Input: /lowstate/imu_state/accelerometer[2]
The Z accelerometer reflects impact forces. Each heel strike creates a sharp impulse. FFT reveals:
- Peaks at step frequency (same as gyroscope)
- Peaks at the robot frame's natural resonance frequency — this is what you're hunting for
Reading the FFT Plot: Identifying Mechanical Resonance
After computing, PlotJuggler adds a new channel:
/lowstate/imu_state/gyroscope[1]_fft_gyroY
Drag it into an empty panel. The X-axis is now frequency (Hz) instead of time.
Key frequency zones for G1:
0 - 3 Hz:     Gait zone — normal peaks at step frequency
3 - 15 Hz:    Gait harmonics + upper body oscillations — a few peaks are normal
15 - 50 Hz:   Danger zone — strong peaks here = mechanical resonance or controller ringing
50 - 250 Hz:  Control frequency range (500 Hz / 2 = 250 Hz Nyquist) — should be nearly flat
Red flags in the FFT:
| Observation | Meaning |
|---|---|
| Sharp peak at 20-40 Hz on gyroY | Knee/hip resonance in sagittal plane — check joint damping |
| Sharp peak at 30-60 Hz on gyroX | Lateral resonance — often ankle roll compliance being too high |
| Peak at 10-20 Hz that disappears when standing still | Resonance excited by gait — dynamic coupling between step frequency and structural natural frequency |
| Broad frequency band (not a sharp peak) | Non-uniform friction in joints — different problem from resonance |
Practical example:
In a typical G1 debug session:
ωy FFT during walking:
  - Peak at 1.4 Hz (gait)     → normal (~84 steps/min cadence)
  - Peak at 2.8 Hz (harmonic) → normal
  - Sharp peak at 28 Hz       → !! Right knee mechanical resonance !!

Cross-check:
  - Run FFT on motor_state[3]/tau (right knee torque)
  - If 28 Hz peak appears in torque too → controller fighting the resonance
  - Fix: add a 28 Hz notch filter to the joint PD controller
Using Multiple FFT Panels for Comparison
Split the screen and compare:
Left panel:  FFT gyroscope[1] (pitch axis)
Right panel: FFT motor_state[3]/tau (knee torque)

→ Peak at same frequency in both → mechanical resonance
→ Peak only in torque → controller oscillation not reaching IMU
→ Peak only in IMU → environmental vibration (floor, fans)

Part 3: Moving Average — Smoothing Foot Force Data
Why Foot Force Needs Smoothing
The /lowstate/foot_force[0..3] channels measure contact force between feet and ground as int16 (relative units, not Newtons). The raw signal is very "spiky":
Raw foot force (500 Hz):

Force │
 100  │     ████         ████
  80  │   ██████       ██████
  60  │ ████████     ████████
  40  │██████████   ██████████
  20  │
   0  │──│──│──│──│──│──│──│──│── time (s)
       stance  swing  stance  swing

Heel strike creates sharp impulses (1-2 ms) — difficult to analyze visually
With a Moving Average filter of 25 samples (= 50 ms at 500 Hz):
Smoothed foot force:

Force │
 100  │      ▄████▄          ▄████▄
  80  │   ▄████████▄      ▄████████▄
  60  │ ▄████████████▄  ▄████████████▄
  40  │████████████████████████████████
  20  │
   0  │──│────────│──│──│────────│──── time (s)
         ← stance phase → swing

Gait pattern clearly visible — easy to read and analyze
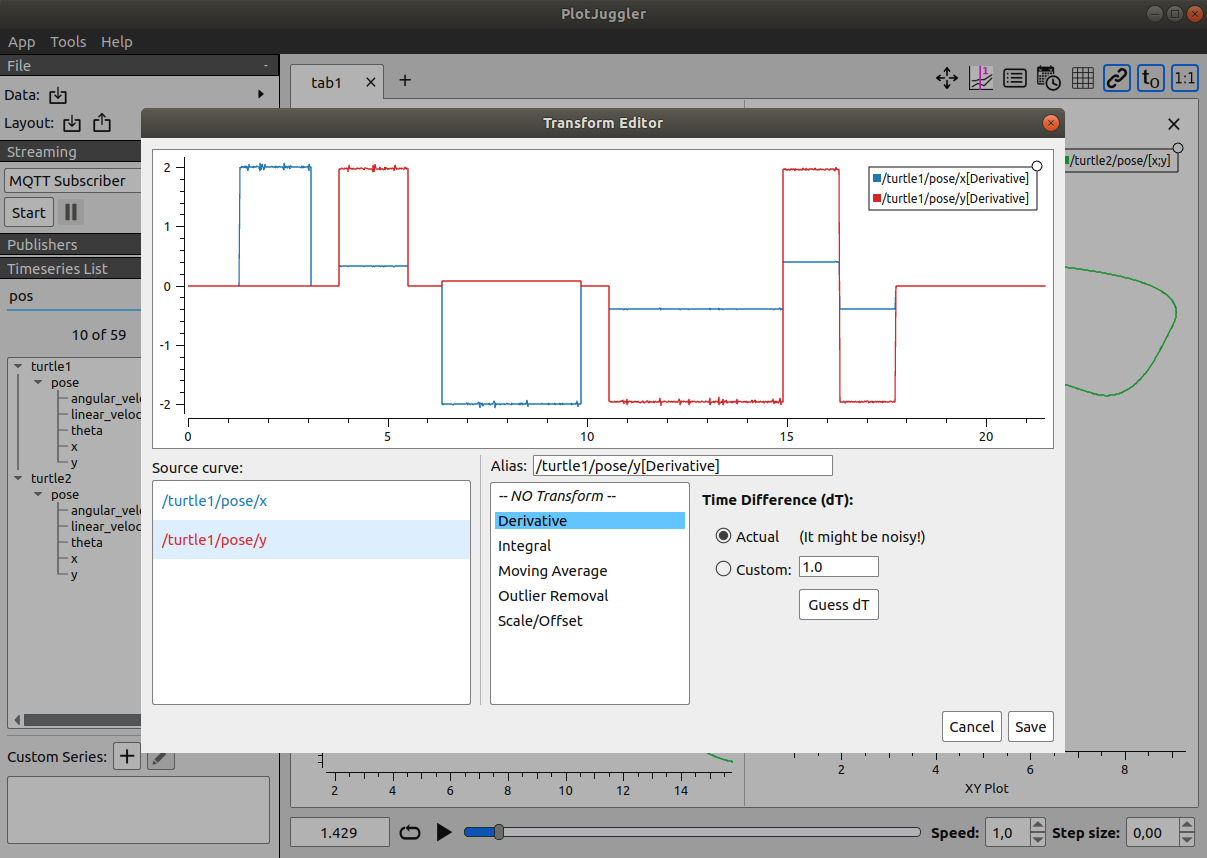
Applying Moving Average in PlotJuggler
This is a built-in transform — no additional plugin required:
Method 1: Right-click directly on the plot curve
- Drag
/lowstate/foot_force[0]into a panel - Once the curve appears, right-click on it → "Apply Transform"
- Select "Moving Average" from the dropdown
- A parameter dialog appears:
┌─────────────────────────────────────────────────────┐
│  Moving Average Transform                           │
│                                                     │
│  Window size (samples): [25                    ]    │
│                                                     │
│  * At 500 Hz sample rate:                           │
│    25 samples = 50 ms                               │
│    50 samples = 100 ms                              │
│    250 samples = 500 ms                             │
│                                                     │
│  [Apply]                  [Cancel]                  │
└─────────────────────────────────────────────────────┘
- Enter
25→ Click Apply
PlotJuggler replaces the original curve with the smoothed version. The channel name updates to /lowstate/foot_force[0]::MovingAverage(25).
Method 2: From Signal List (apply to all 4 channels simultaneously)
- In Signal List, expand
/lowstate/foot_force - See
[0],[1],[2],[3] - Press
Ctrl+Ato select all four channels - Drag all four into a panel
- Right-click any curve → "Apply Transform to ALL curves" → Moving Average → Window 25
Choosing the Right Window Size
| Window size | Duration at 500 Hz | Best for |
|---|---|---|
| 5 samples | 10 ms | Remove only electrical spikes — heel/toe strikes still visible |
| 25 samples | 50 ms | Recommended — smooths heel strike while preserving gait shape |
| 50 samples | 100 ms | Overall stance/swing pattern analysis |
| 250 samples | 500 ms | Strong low-pass — only shows weight shift between feet |
Note: G1's foot_force is not an absolute Newton measurement — it's a relative strain gauge signal. Use it to analyze patterns (which foot lifts first? how long is the stance phase?) rather than comparing absolute values across sessions or configurations.
Gait Analysis from Smoothed Foot Force
With all four foot_force channels smoothed and in the same panel:
Channels:
  /lowstate/foot_force[0]  ← Left foot
  /lowstate/foot_force[1]  ← Right foot
  /lowstate/foot_force[2]  ← Left heel/toe (varies by G1 variant)
  /lowstate/foot_force[3]  ← Right heel/toe

Normal pattern (walking):
  Left:  ████████▀▀▀▀▀▀▀████████▀▀▀▀▀▀▀████████
  Right: ▀▀▀▀████████▀▀▀▀▀▀▀████████▀▀▀▀▀▀▀████
         ← brief double-support overlap at each step transition
Warning signs to look for:
| Observation | Meaning |
|---|---|
| One foot consistently > 20% higher force than the other | Gait asymmetry — check PD gains for each side |
| Spike > 2× average value in < 5 ms | Heel strike too hard — check ankle compliance |
| Force doesn't return to zero during swing phase | Sensor drift or insufficient foot lift height |
| Both feet simultaneously drop to zero | Robot jumped or slipped |
Combining Moving Average with Phase Portraits from Part 2
You already know how to create phase portraits (q vs dq) from the previous article. Add another insight layer by syncing with foot_force:
-
Open two tabs in PlotJuggler:
- Tab "Kinematics": ankle pitch phase portrait (joints 4 and 10)
- Tab "Force": smoothed foot_force
-
Use Vertical Marker (right-click → Add Vertical Line) at the moment of heel strike (when foot_force spikes up)
-
The marker appears on both tabs simultaneously — you immediately see ankle position and velocity at ground contact
This tells you directly: is the ankle at the right angle when it hits the ground? If q[4] (right ankle pitch) is at -0.3 rad during heel strike when the design intends -0.1 rad → landing too aggressively, adjust foot placement in the motion planner.
Complete Workflow: 10-Step IMU Debug Session
# 1. Environment setup (see part 1 if not yet configured)
source /opt/ros/humble/setup.bash
export RMW_IMPLEMENTATION=rmw_cyclonedds_cpp
export CYCLONEDDS_URI=file:///home/$USER/cyclonedds_g1.xml

# 2. Start recording in parallel (always record during important debug sessions)
ros2 bag record --storage mcap \
  -o ~/g1_bags/g1_imu_$(date +%Y%m%d_%H%M%S) \
  /lowstate

# 3. Launch PlotJuggler
ros2 run plotjuggler plotjuggler

# 4. Subscribe or load MCAP
# Live: Streaming → Start → ROS2 Topic Subscriber → /lowstate → OK
# Offline: File → Load Data File → select .mcap
Inside PlotJuggler (in order):
Step 5: Create baseline panels
  - Panel A: /lowstate/imu_state/rpy[0] and rpy[1] (firmware roll/pitch)
  - Panel B: /lowstate/foot_force[0..3] (raw, unsmoothed)

Step 6: Apply ToolboxQuaternion
  - Tools → Toolboxes → Quaternion To RPY
  - Map quaternion[0..3] to W/X/Y/Z → Suffix: _pj → Compute
  - Add new channels to Panel A to compare against firmware rpy

Step 7: Apply Moving Average to foot_force
  - Right-click each foot_force curve → Apply Transform → Moving Average → 25
  - Or select all → Apply to ALL curves

Step 8: Run FFT on gyroscope
  - Tools → Toolboxes → FFT
  - Input: /lowstate/imu_state/gyroscope[1] → Window: Hann → Last 10s → Compute
  - Add Panel C for the FFT output channel
  - Repeat for gyroscope[0] and accelerometer[2]

Step 9: Analyze results
  - Compare firmware rpy vs quaternion Euler → any drift?
  - Look for unexpected FFT peaks at 15-50 Hz
  - Read gait pattern from smoothed foot_force

Step 10: Save layout
  - File → Save Layout → g1_imu_fft_v1.xml
Summary: What You Can Now Diagnose
After this article, you have three IMU analysis tools at hand:
| Tool | How to Access | Question It Answers |
|---|---|---|
| ToolboxQuaternion | Tools → Toolboxes → Quaternion To RPY | How much is the robot tilted? Is firmware accurate? |
| ToolboxFFT | Tools → Toolboxes → FFT | Any abnormal vibration frequency? Where is the resonance? |
| Moving Average | Right-click curve → Apply Transform → Moving Average | What's the gait pattern? Which foot lifts first? |
When to reach for each tool:
- Robot drifts when standing still → ToolboxQuaternion: compare firmware vs raw quaternion to isolate whether it's a filter or sensor problem
- Joint makes noise or vibrates oddly during walking → ToolboxFFT: find frequency peaks in gyroscope and torque to identify mechanical resonance
- Asymmetric gait or hard heel strikes → Moving Average foot_force + ankle phase portrait: see which foot has abnormal loading and at what angle
The next article goes further: instead of using built-in tools, we'll write custom Lua scripts to calculate metrics PlotJuggler doesn't provide — power consumption per joint, slip index derived from foot_force and velocity, or torque-to-velocity ratio to detect nonlinear motor behavior.
Related Articles
- Part 2 — Visualize G1's 23 Joints: MCAP Replay & Layout XML — Multi-panel layout, phase portraits, reusable XML layout files
- Part 4 — Lua Transforms: Power per Joint and Derived Signals — Custom Lua scripts in PlotJuggler to create entirely new metrics
- Debug MPC/WBID G1 with PlotJuggler in MuJoCo — Sister series: applying the same techniques in MuJoCo simulation